Fantasy Baseball Injury Report: Good News for Twins
Jeff Stotts discusses this week's prominent MLB injuries, starting in Minnesota, where Carlos Correa should miss less time than originally thought with a low-grade intercostal strain.
Featured
Recent
Fantasy
DFS
Betting
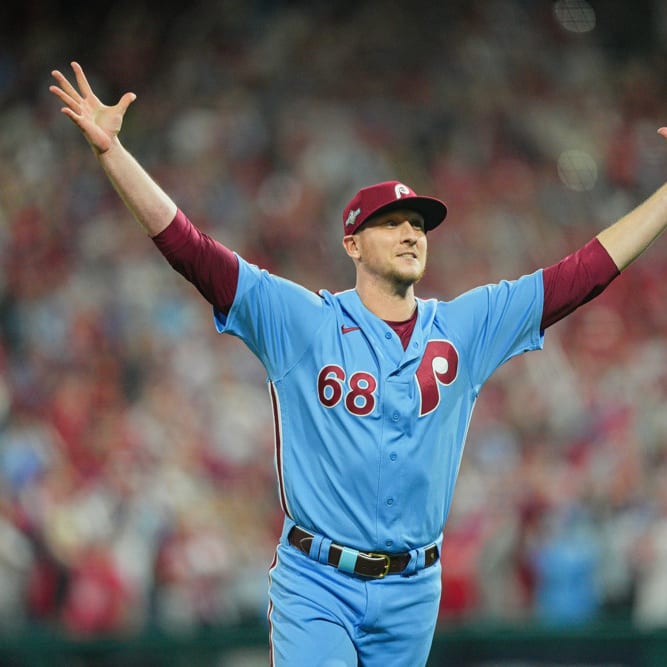
NL FAAB Factor: Waiver Wire for the Week
A couple Philly pitchers highlight Jan Levine's latest NL rundown.
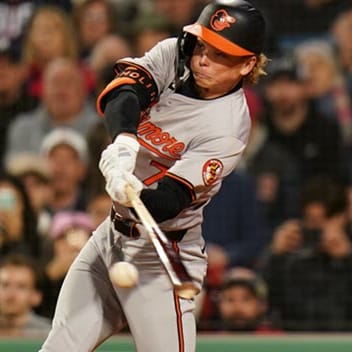
AL FAAB Factor: Waiver Pickups of the Week
Erik Siegrist looks over the free-agent options in the American League as the Jackson Holliday era begins in Baltimore.

Week 3 FAAB Results - Sad Strider Drops
This is the week where we saw the sad Spencer Strider drops on the waiver wire, including a couple of Jeff Erickson's teams.
Weekly Hitter Rankings: Manic Monday
Todd Zola presents the Weekly Hitter Rankings.

MLB Barometer: Everyone's Hurt, but at Least Mike Trout Is Healthy
Starters may be dropping like flies, but at least we get to watch the best version of Mike Trout we've seen in years.

NFL Draft Decisions: Navigating Make-or-Break Moments
Jim Coventry examines the quarterback trends from past NFL Drafts -- including five times teams hit the jackpot in taking their QB of the future.

Browse All Fantasy Articles
Check out our full list of fantasy articles now.


Top News

Christian YelichMLB
Lands on injured list
Joel EmbiidNBA
Officially questionable

Ozzie AlbiesMLB
Out with fractured toe

Jordan RomanoMLB
Activated Tuesday, as expected

Josh LoweMLB
Beginning rehab stint Thursday
Jack LeiterMLB
Making MLB debut Thursday
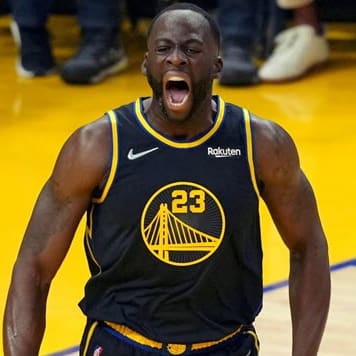
Draymond GreenNBA
Cleared for Play-In Tournament
Stephen CurryNBA
Removed from injury report
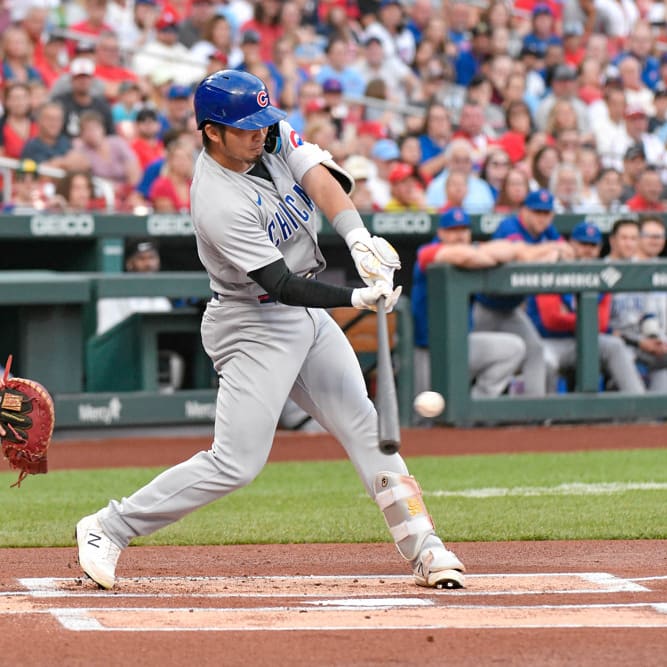
Seiya SuzukiMLB
Moved to 10-day IL
LeBron JamesNBA
Probable for Tuesday
Anthony DavisNBA
Officially questionable
Jake GuentzelNHL
Resting Tuesday
Fantasy Football

Fantasy Baseball
Fantasy Basketball
Fantasy Soccer


Fantasy Golf
College Football


College Basketball


Mixed Martial Arts
Fantasy NASCAR
Canadian Football


WNBA


EuroLeague


New users can unlock $150 in instant bonus bets for NBA Play-In betting & MLB odds by signing up with BetMGM North Carolina bonus code ROTOBONUS.

Sports fans can unlock a $1,000 first-bet offer when they register for a new account with Caesars Sportsbook promo code ROTO1000. Wager on NBA Play-In odds like Lakers-Pelicans and Warriors-Kings.
Sports fans can get $1,500 in bonus bets for the NBA Play-In Tournament with BetMGM bonus code ROTOBONUS. Wager on Lakers-Pelicans, Warriors-Kings and additional MLB odds.
Check out the latest betting promos
→